

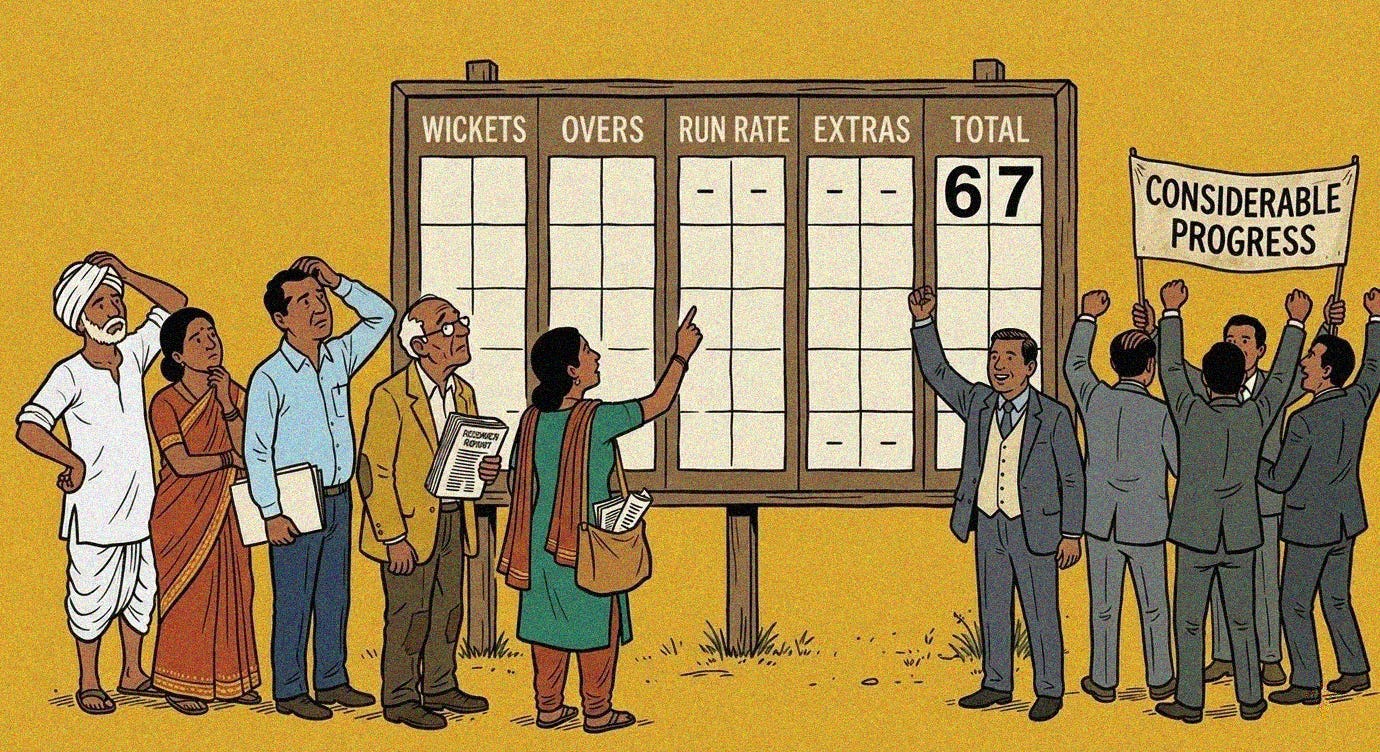
Number Go Up
RBI's Financial Inclusion Index always goes up. But what do I do with that information?
On January 10, 2020, the Reserve Bank of India (RBI) published its National Strategy on Financial Inclusion (NSFI) 2019-2024. The strategy notes:
Periodic evaluation of financial inclusion policies through monitoring of financial inclusion parameters provides policy makers and stakeholders with necessary insights to understand the achievements made in the country and to address issues and challenges through a coordinated approach.
To deliver on this, the RBI released its Financial Inclusion (FI) Index in August 2021. The FI Index was designed as a comprehensive, single-number measure incorporating data from banking, investments, insurance, postal services, and pensions, built in consultation with the government and sectoral regulators. It maps financial inclusion onto a scale of 0 to 100, where 0 represents complete exclusion and 100 indicates full inclusion. It reflects cumulative progress over time.
The index is composed of three sub-indices:
Access (weighted at 35%), which measures the availability of financial infrastructure;
Usage (45%), which captures how actively that infrastructure is used; and
Quality (20%), which accounts for financial literacy, consumer protection, and inequality in the distribution of services.
Here is what the index has shown since:
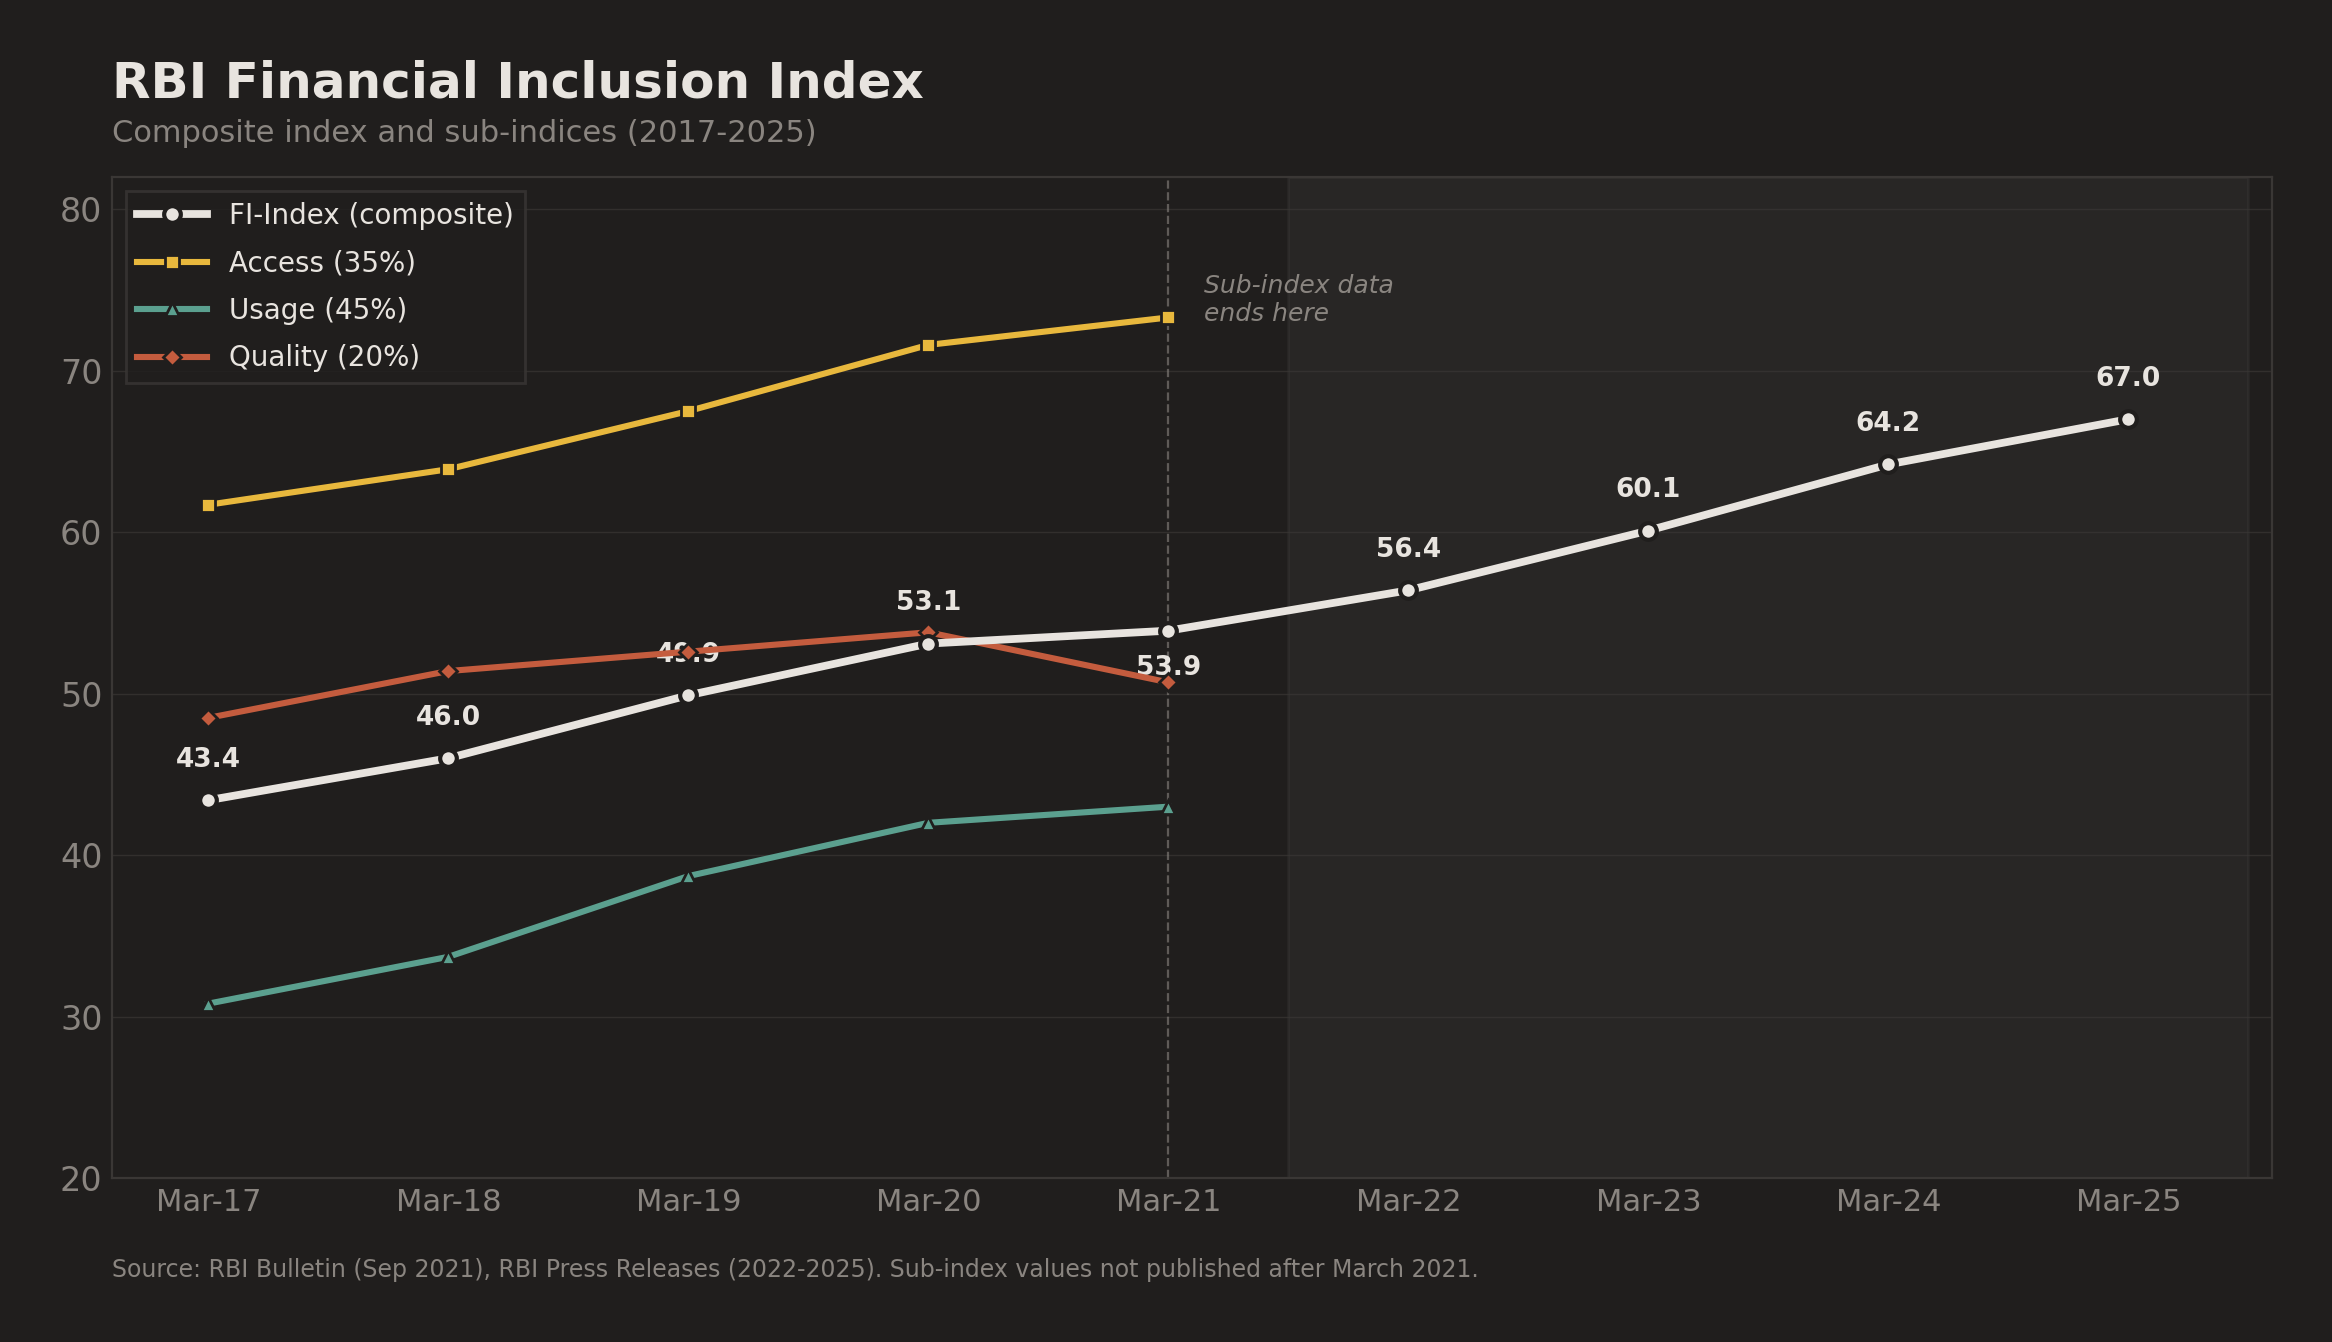
The number has indeed gone up, from 43.4 to 67.0 in eight years. And that’s a great thing.
In the five years for which the RBI published the breakdown up to the sub-index level, a few things clearly stand out. Access has always been far ahead of Usage. In March 2021, Access stood at 73.3 while Usage sat at 43.0. The composite index, by blending the two into a single number, obscures this gap entirely. Quality is the only sub-index that has ever declined, from 53.8 in March 2020 to 50.7 in March 2021. But the headline FI Index still went up, from 53.1 to 53.9. The composite absorbed a deterioration in the quality of financial inclusion and still reported progress.
But that is fine, as long as you also get the sub-index data.
And then, voila. Starting with the March 2022 release, the RBI stopped publishing the Access, Usage, and Quality scores. The annual press release now reports only the headline number, usually accompanied by a single sentence noting “growth across all sub-indices.” How much growth? Which sub-index? We have no way to know.
If the FI Index was built to give policymakers the insights they need to address challenges, why does it only seem to work as a vehicle for reporting progress? We got the detail only as long as the numbers went up. The only insight I get from the index is that the arc of history bends towards progress. And that is something I don’t need the Reserve Bank of India to tell me.
I got 97 parameters
The FI Index is built on 97 underlying parameters. Not only are their values never published but we do not even know precisely what all of them are. The only public indication of what goes into the index comes from a 2021 RBI Bulletin article, which describes the broad dimensions but not the specific parameter values or their individual scores. You cannot tell whether the improvement is coming from banking, insurance, pensions, or postal services. And inside banking, whether the improvement is from increasing banking correspondents or actual branches, both of which can give different quality of services to the end user. The index has no state or district breakdowns, no gender disaggregation either.
Then there is the Usage sub-index, which earns its label only partially. The NSFI 2019-2024 gives us some indication of what it may contain: formally banked accounts, adults with credit, adults with insurance, cashless transactions, frequency of account usage, remittances. These are not wrong as usage metrics. But they are the easier ones to count, drawn mostly from data that banks are already reporting to the RBI anyway. Whether there are richer demand-side indicators in the mix, actual surveys of whether people are actively and meaningfully using financial services, we will never know. Running a demand-side financial inclusion survey would not be trivial. But the RBI has shown it can commission complex surveys, like the ones that drive its monetary policy.
We have been here before.
In 1990-91, the gross enrolment ratios in India's primary schools were 83.8% and in elementary schools 78.6%. Against that, literacy rates for ages seven and above in 1991 were just 52.2%. It had become clear that enrollment was not the magic potion anyone thought it was.
In response to this crisis, Pratham Education Foundation started bringing out the Annual Status of Education Report (ASER) surveys. Every year, Pratham comes out with the ASER report, forcing all of us to, at least for a moment, face the utter pit that school education in India is. For example, the latest edition, ASER 2024, found that nearly 30% of school-going children in rural India still cannot read a Class II textbook. The Research on Improving Systems of Education (RISE) puts it well:
Established in a time when the primary assumption was that getting children into schools (inputs) would automatically result in children learning (outputs), ASER not only questioned this assumption but also highlighted the flaws in it.
ASER is still the only survey of learning in India that tells you what is happening at the district, state and national levels. It has brought learning to the forefront of education policy discourse and driven interventions to overcome the challenges.
Pratham recognised that in order to help children learn in school, we must first measure what children have already learned. The FI index falls short of that. It measures whether the pipes are being built. The water is someone else's problem.
The Proof of the Pudding
The FI Index is still stuck on enrollment. It tells you how many people have been brought into the formal financial system. It does not tell you whether any of them can manage a health shock, plan for retirement, or meet their monthly expenses without borrowing from a neighbour.
Dvara Research and XKDR Forum, writing in the Inclusive Finance India Report 2022, went and asked those harder questions. They built a framework that measured three distinct things: financial access, actual usage of financial products, and whether any of it was translating into household wellbeing. Then they applied it to India’s data in the World Bank’s Global Findex survey.
Inputs, which stand for access and ownership of financial products, scored 0.78. India has spent a decade opening accounts, enrolling people in insurance schemes, and pushing pension products through government programmes, sometimes without their knowledge. All those press releases are not lying.
Outputs, which show whether people are actually using what they own, scored 0.19. Outcomes, which show whether any of this is improving people’s financial lives, scored 0.30. Bank account ownership in India is widespread, the chapter notes, but most of these accounts are dormant.
In a separate study using CMIE’s Consumer Pyramids data covering 174,000 households, Dvara Research found that measuring financial inclusion through bank account ownership alone overestimates inclusion by 30 points for rural India. A bank account penetration score of 0.84 collapses to a composite score of 0.55 once you account for the full bouquet of what financial inclusion actually means: credit, insurance, pensions, investments.
To add to the problem, the rank correlation between supply-side state rankings and demand-side state rankings was 0.13 for rural India. States that look good on supply-side metrics do not necessarily look good when you ask households what they actually own, use, and need.
PDFs All the Way Down
The farmer in Dadenggre suffers from very different kinds of exclusion than a street vendor in Delhi. Excluded in different ways, for different reasons, needing different things. The unit at which financial inclusion problems actually get solved is not just the national or state level but also the district and block level. To do anything about financial exclusion, you need to see it at that level.
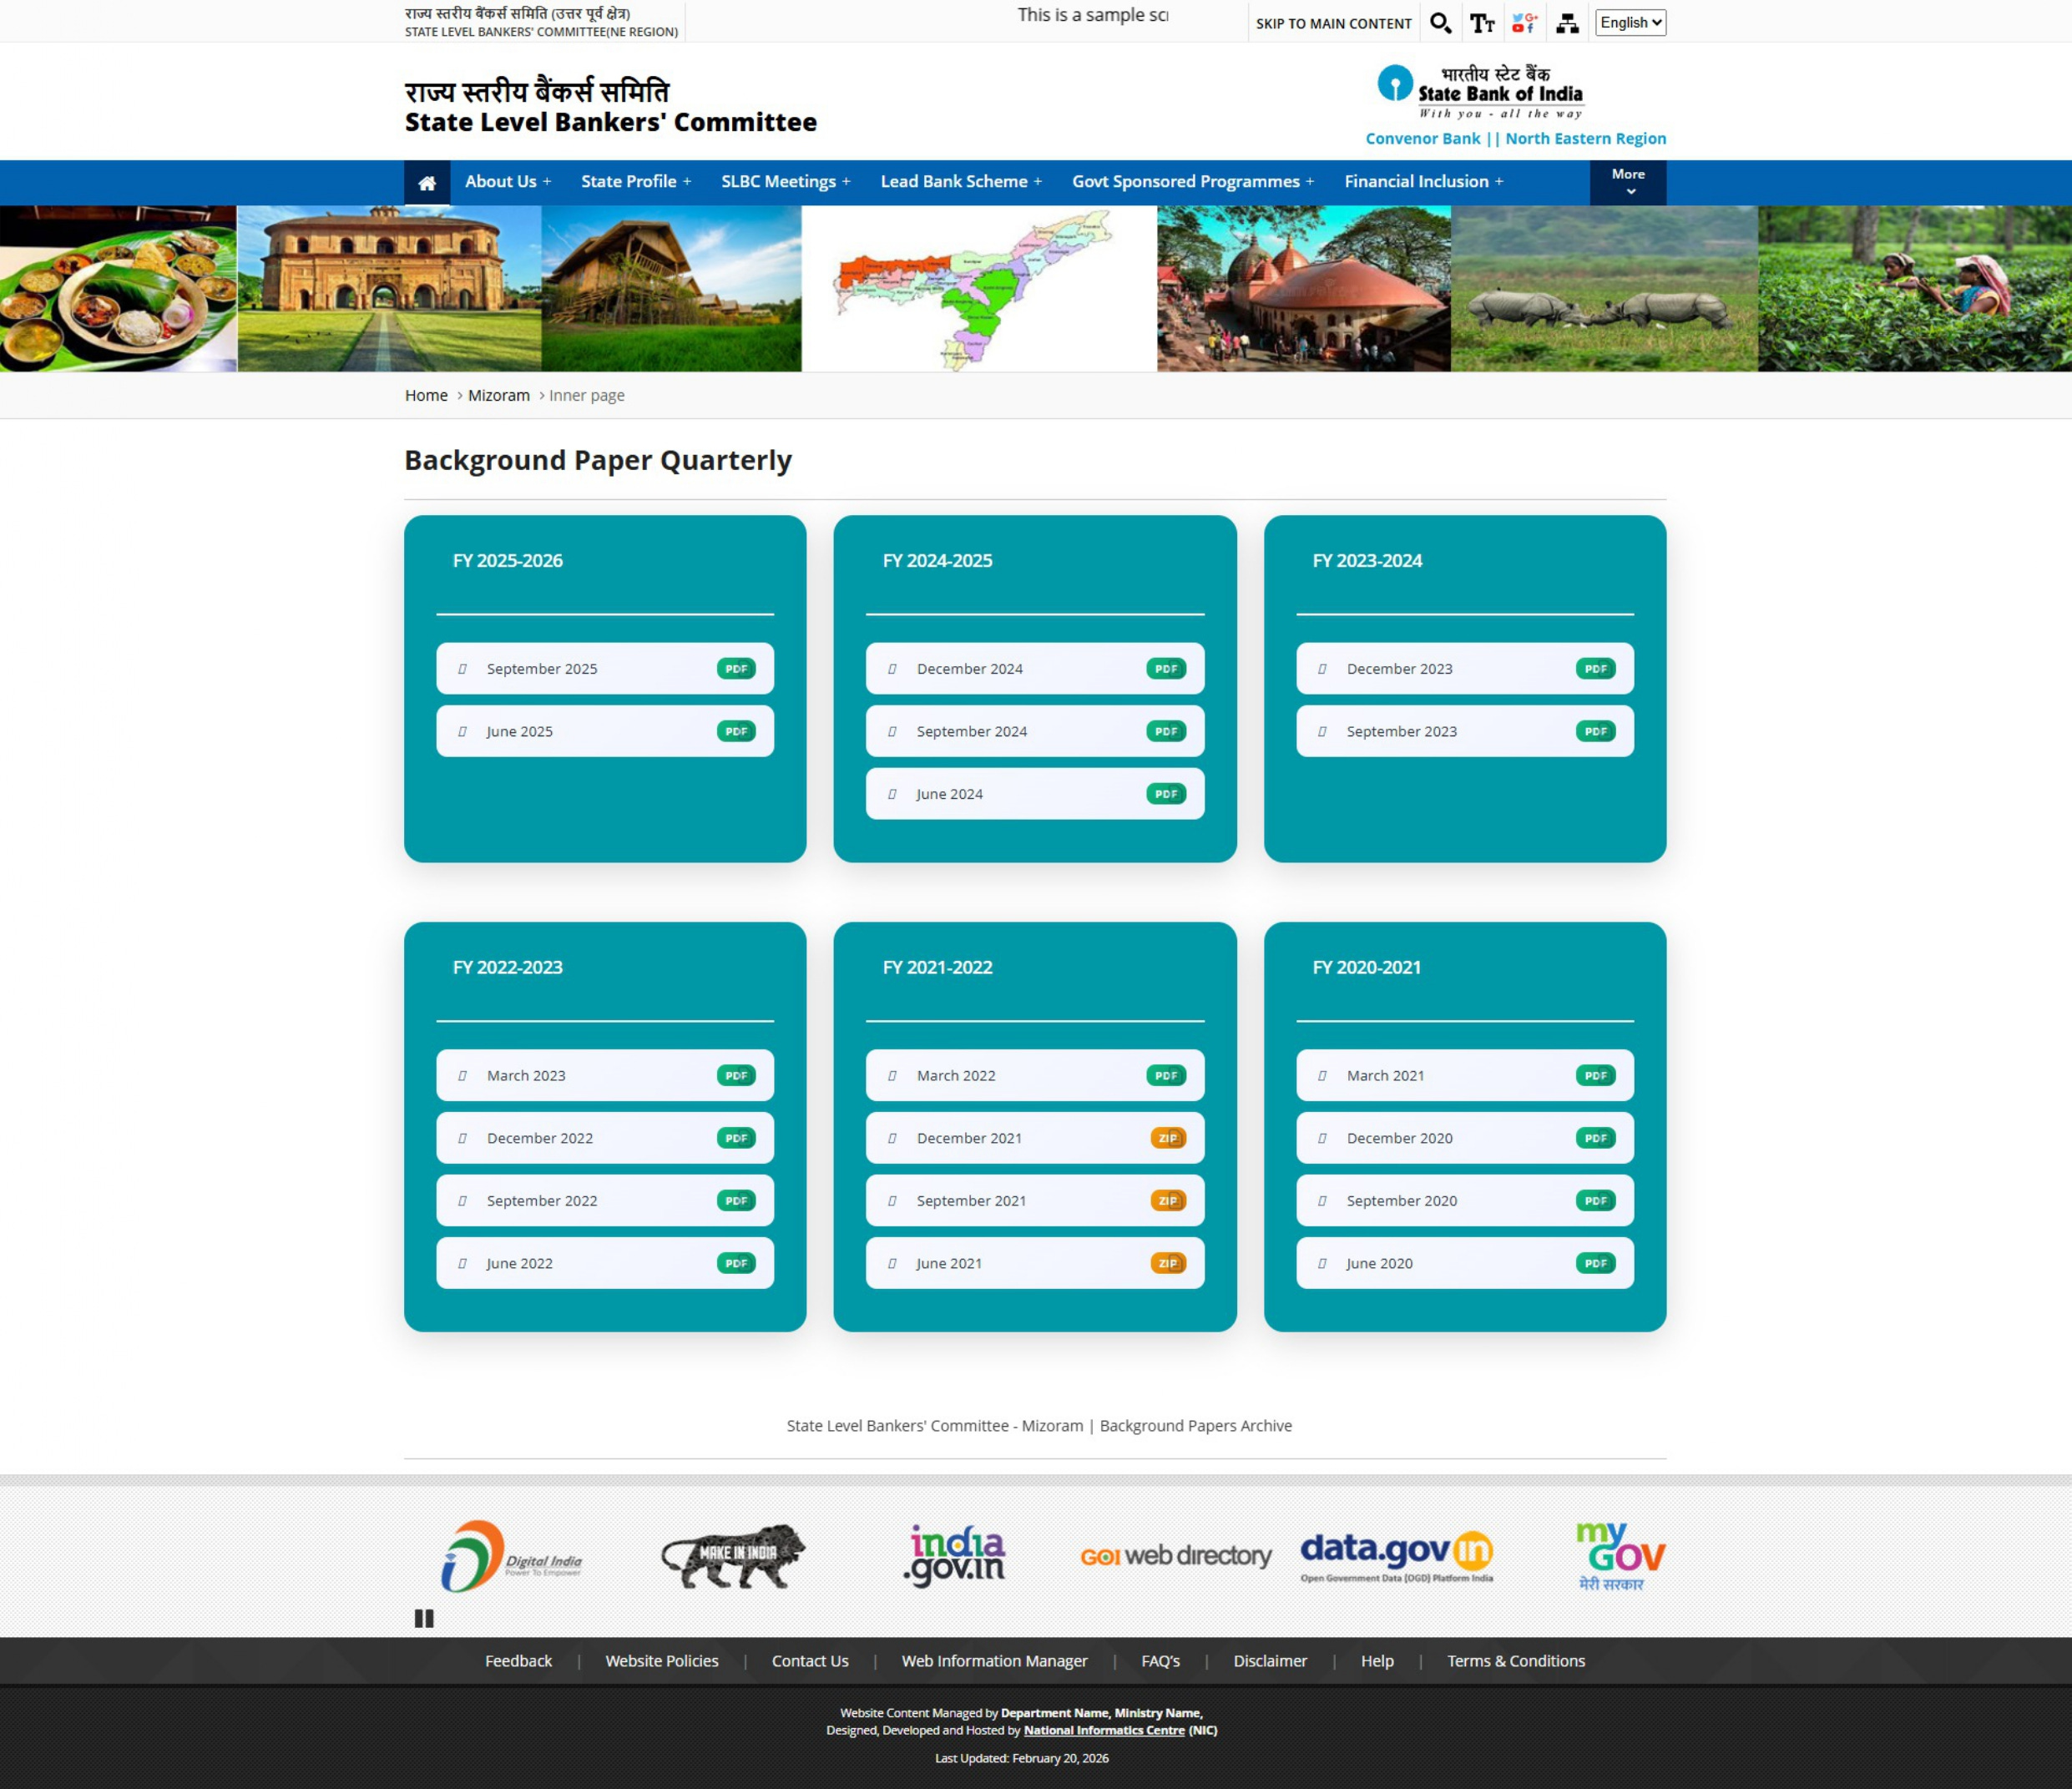
This data is not entirely absent. Every quarter, State Level Bankers Committees (SLBCs) produce detailed background papers with district-level financial inclusion statistics including branch coverage, credit-deposit ratios, account penetration, Business Correspondent deployment. The papers are produced on schedule, reviewed by bankers and government officials, and then infrequently uploaded on poorly maintained websites.
But the SLBC data is produced for the regulators and state government officials who sit around that table. A civil society organisation working on last-mile delivery, a researcher trying to understand why a particular district consistently underperforms on credit-deposit ratios, a journalist asking whether financial inclusion expenditure is actually reaching anyone: none of them have a clean, structured, comparable way to engage with this data. It exists, when it does, in PDFs, ZIPs, RAR files, excel sheets, sometimes scanned ones (I am talking to you, Bihar). It changes format across quarters. It changes shape across states.
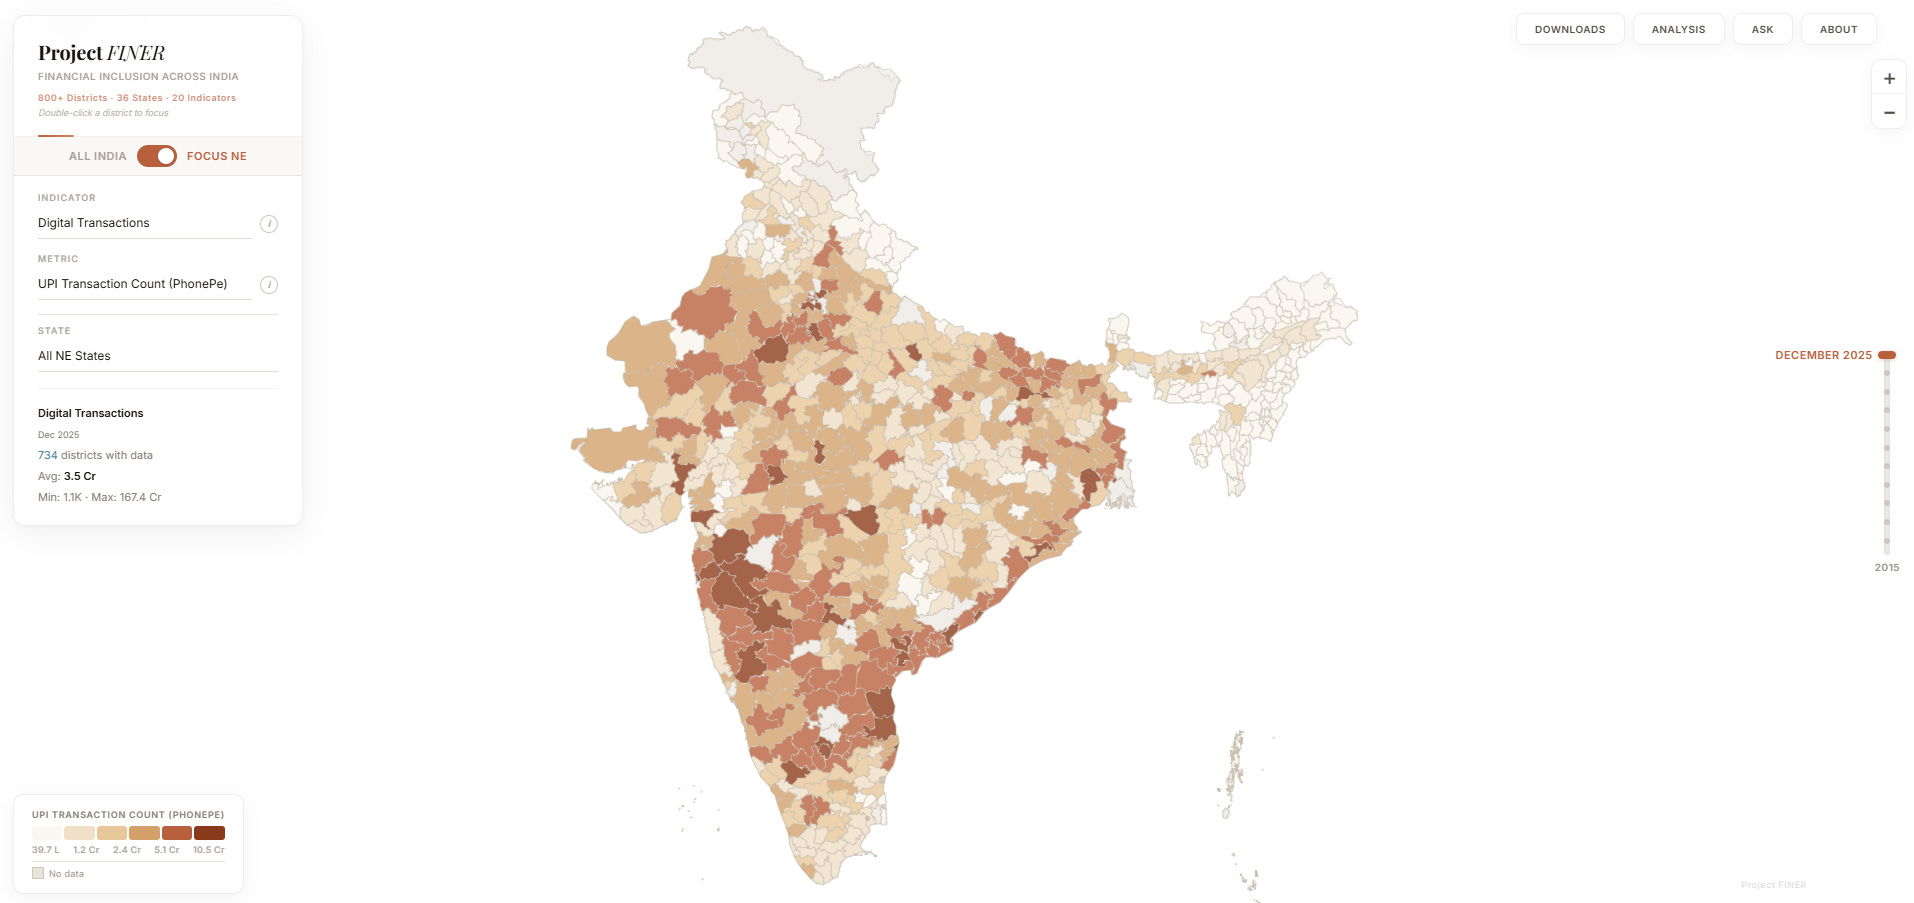
I ran into this directly while working on Project FINER, which stands for Financial Inclusion in the North East Region (yes, I would be a great asset in any government scheme naming department). It is my attempt at making machine-readable financial inclusion data available down to the district level, and eventually the block, with tools to visualise and analyse it without any technical background. I want to expand it to cover all of India eventually. But most states do not make this data available in any usable form.
The Northeast is, oddly, better served than the rest of the country on this front. SBI has been publishing more structured SLBC data for the region on a separate site. For most of the rest of India, you are back to writing essays on why open data is the need of the hour.
Better Late
The Indicus Centre for Financial Inclusion (ICFI) newsletter, which you should be reading, flagged this sentence from the recently released National Strategy for Financial Inclusion (NSFI) 2025-2030:
To begin with, during the period of NSFI 2025-30, a new series of FI-Index with broader coverage and State/UT level disaggregation may be constructed and published.
This is, quietly, an acknowledgment that the current index has not been enough. Now we wait to see how this turns out. The previous NSFI has itself mentioned how "there is also a need to seek views and insights from the end users of the products themselves." But no such exercise was carried out, at least nothing that is publicly available.
ICFI, in a 2023 white paper, recommended that monitoring should move to a body independent of the Ministry of Finance, to avoid what they call “the inherent conflict between its roles as strategy formulator, implementor, and also monitor.” They suggest NITI Aayog, working with the Central Statistical Organisation. The people designing the policies should not also be the ones grading themselves. If past is any indicator, this may just be wishful thinking.
But I live on hope. The arc of history, and all that.
*The usual disclaimer: views here are entirely my own.